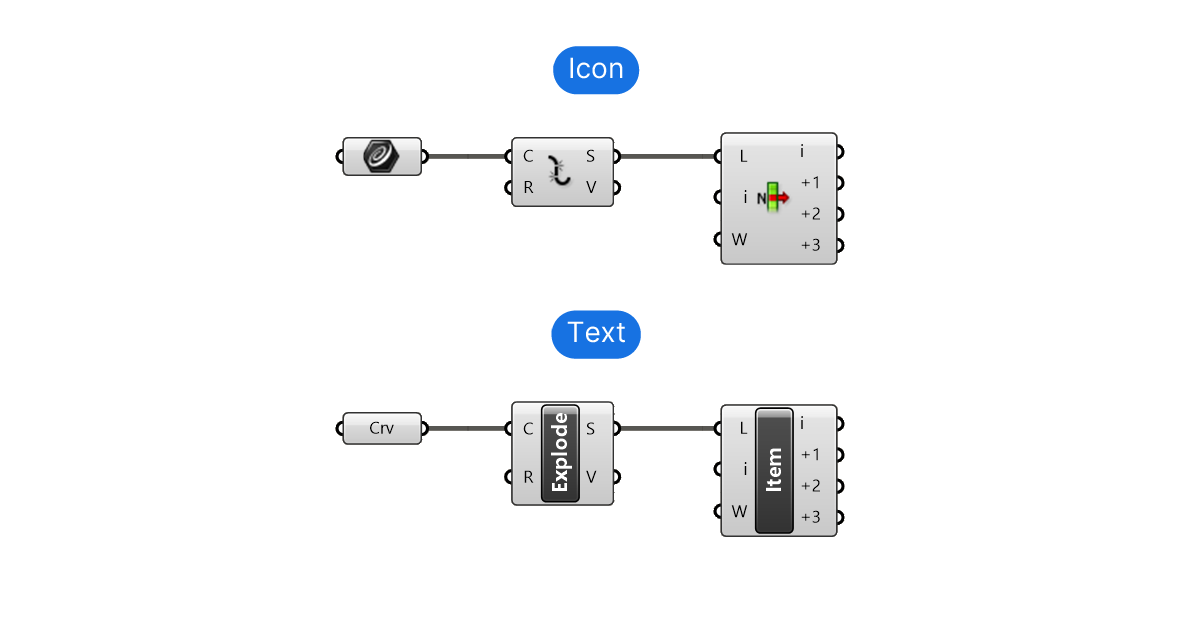
How to Switch Between Icon and Text Display
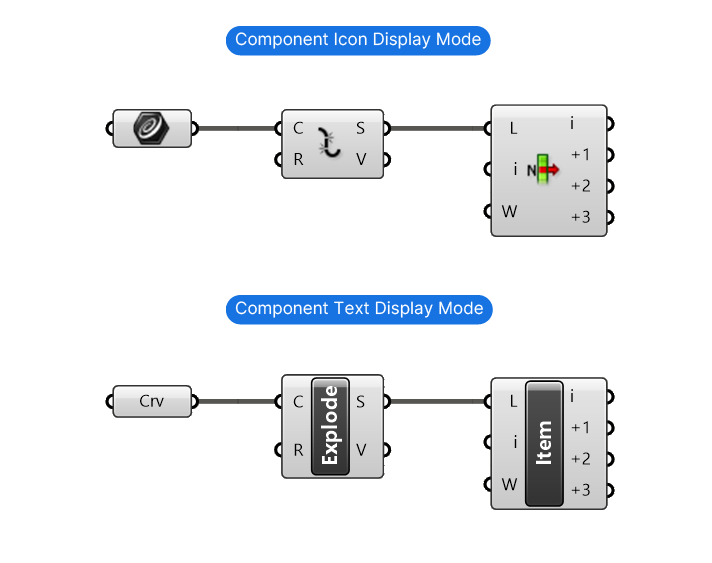
Let’s start with the component names themselves. Grasshopper offers two ways to display the command the component runs: icons or text.
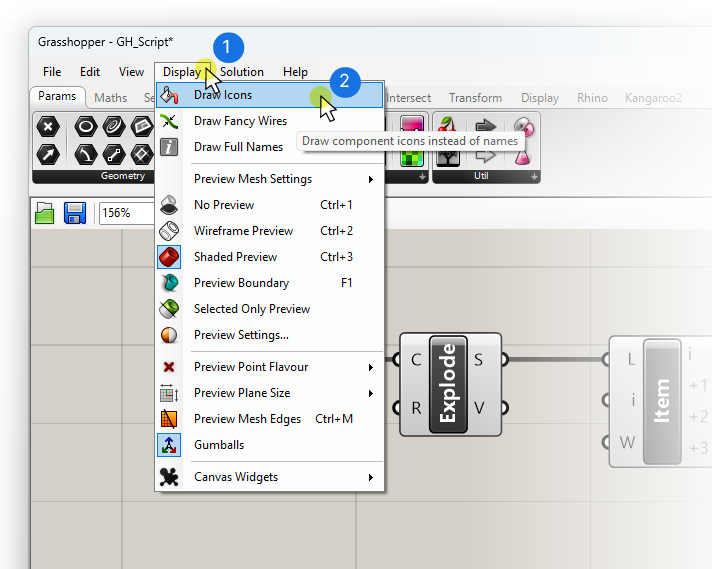
To toggle between icons and text for component names, go to Display > and toggle the ‘Draw Icons‘ option.
How to Show Full Names of Inputs and Outputs in Grasshopper
While this option displays the components’ partial names (since full names would take up too much space), it still displays inputs and outputs as just letters.
Let’s change that.
Grasshopper allows us to either just show letters, usually the first letter of the input (but not always), or the full, descriptive name.
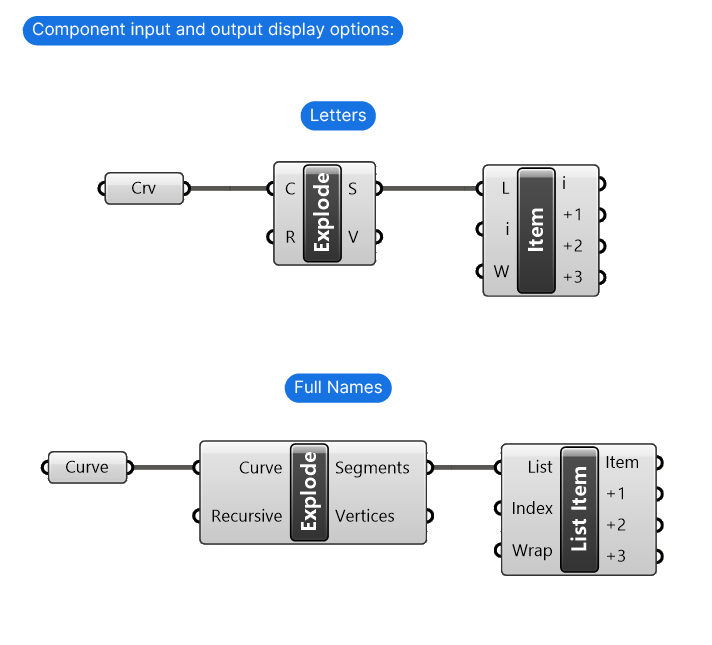
Here’s how to display the full names of component inputs and outputs:
On the top menu bar, go to Display > and turn on ‘Draw Full Names‘.
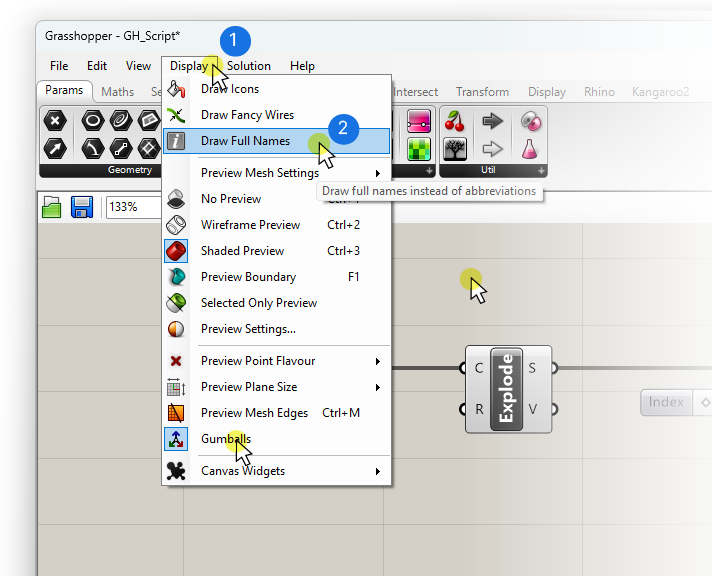
Grasshopper will now display the full names of in-and-outputs on all components on the Grasshopper canvas.
This is a much-requested feature for people starting out with Grasshopper. It takes away the guessing game and shows you clearly which inputs and outputs belong together.
However, this feature’s drawback is that it makes the components quite ‘clunky’ on the canvas, taking up much more space than usual.
As you use Grasshopper more and more, the inputs and outputs will become like second nature, and you’ll naturally gravitate towards single letter display.
How to Adjust the Wire Connection Display in Grasshopper
Grouped with the two display options above is also a wire connection display option. With the ‘Draw Fancy Wire‘ option, we can toggle the wire display between two modes.
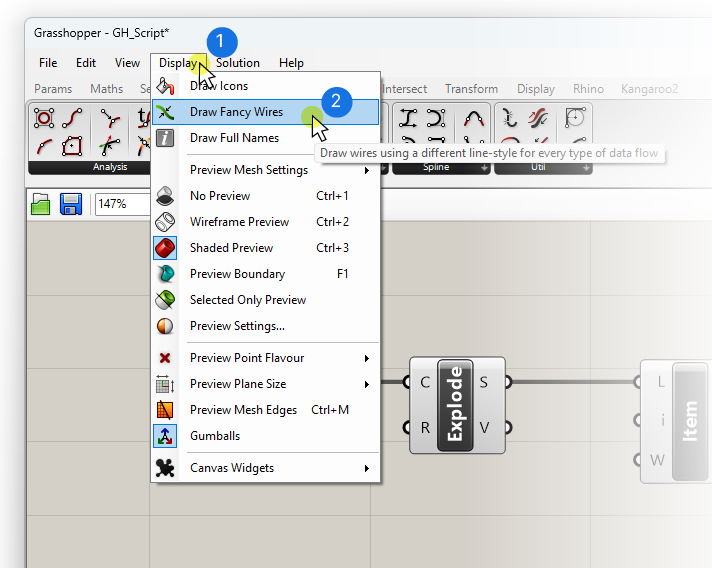
The difference may look subtle at first: with ‘Draw Fancy Wires’ turned off, all wires look the same: a thin black wire.
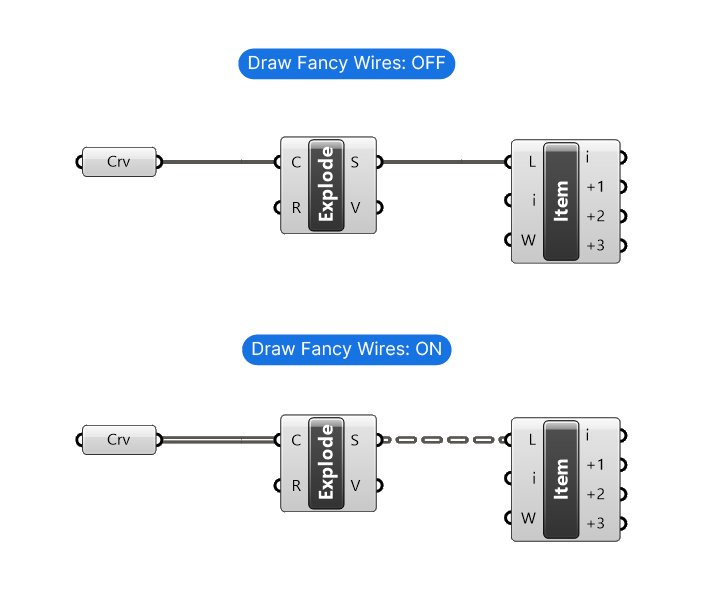
Once ‘Draw Fancy Wires’ is on, there are two kinds of wires. A ‘normal’ wire with a continuous line, and a dashed wire connection.
The dashed wire signifies that the data it is transporting between components is structured in several branches. The normal wire means that the data is either a single item, or items in a single list.
We can display the structure of the data inside a component with the Param Viewer. Here is the data displayed with the Param Viewer:
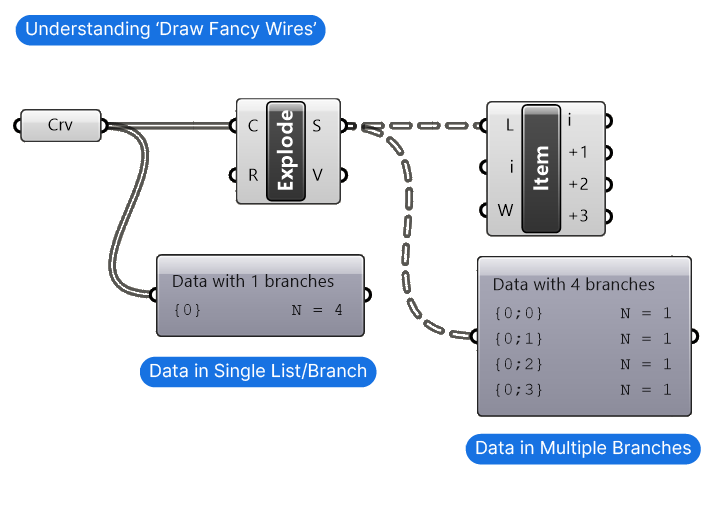
As the Param Viewer reveals, the first component contains a single list or branch with 4 items. Once it’s exploded into segments, each curve gets its own branch, resulting in 4 branches in the data tree. Then the wire turns into a dashed curve.
While this may seem like a small detail, it is a really helpful additional piece of information to have when connecting components. Understanding the distinction between normal and dashed wires can significantly streamline your workflow by providing insight into data organization at a glance.
Happy designing!