Welcome to the world of parametric design in Grasshopper! As architects and designers, the ability to adjust and refine our designs seamlessly is invaluable. This chapter will introduce you to the foundational tools and concepts that make such adaptability possible in Grasshopper. By understanding and harnessing the power of essential components like the Panel, Number Slider, and Expression Editor, you’ll be creating a parametric model in Grasshopper that can be adjusted on the fly.
I’ll guide you step-by-step using a simple example that illustrates the core idea of parametric modelling. By the end of this article, you’ll have a hands-on understanding of how to build a parametric model and make your designs come alive with adaptability.
So, let’s dive in!
Our Project Goal: Crafting Dynamic Curves in Grasshopper
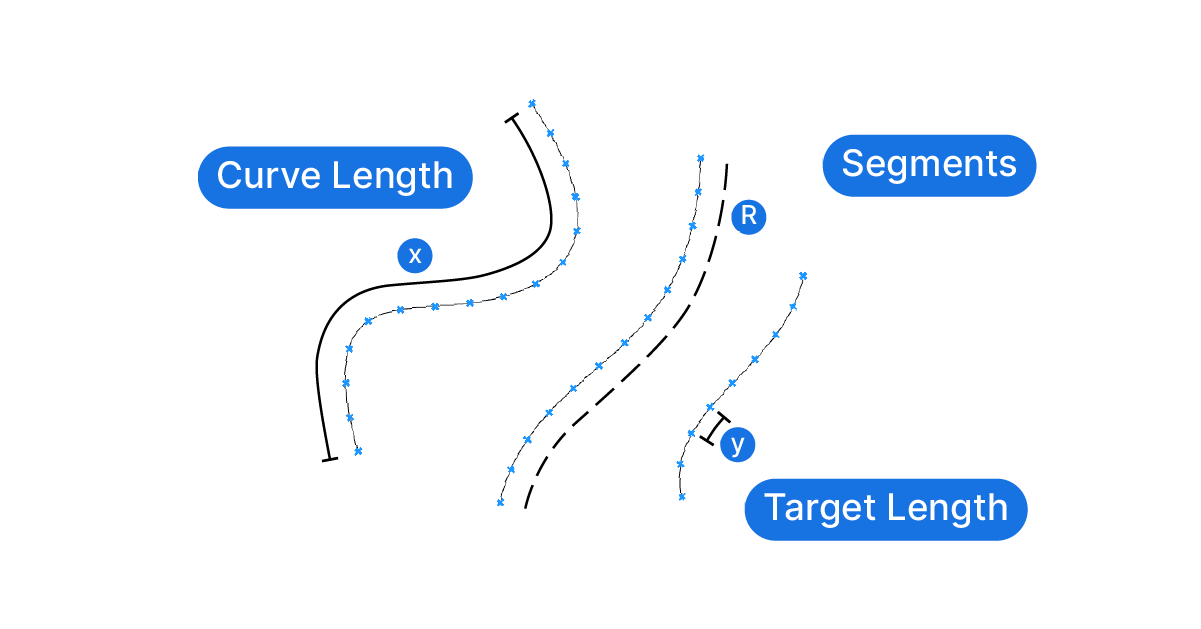
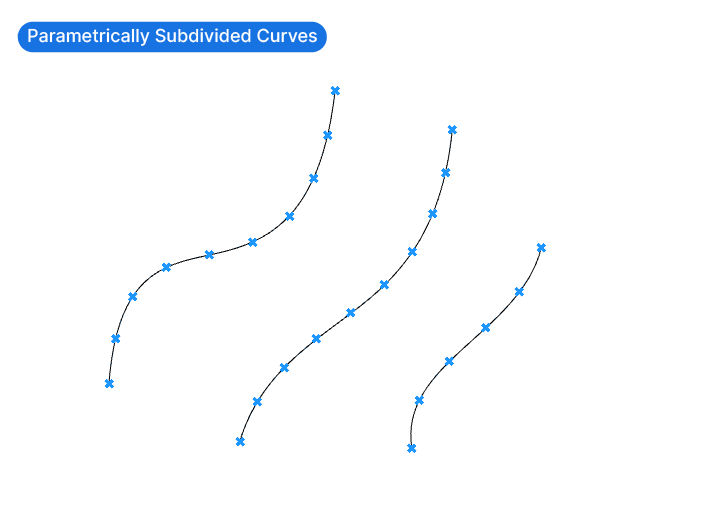
Understanding how to create a parametric model in Grasshopper is easiest when diving straight into a practical application. To showcase the concept behind parametric design, we’ll construct a simple yet dynamic script that will divide curves of different lengths into equally spaced segments that are as close as possible to a target spacing we’ll define.
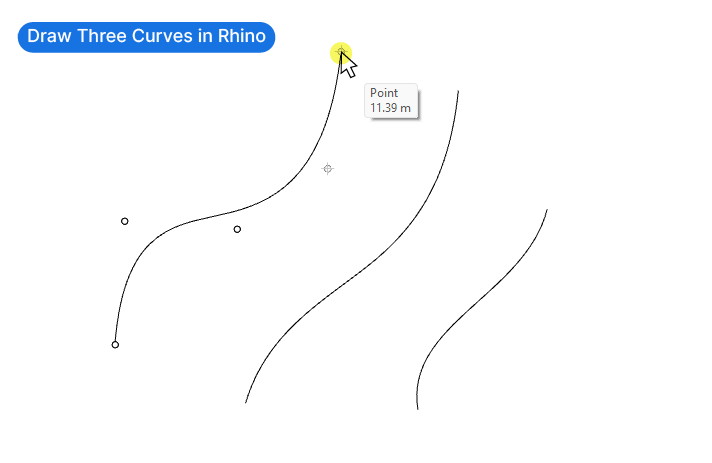
Let’s begin by sketching three distinct curves of varying lengths in Rhino. These curves will serve as the starting point of our script.
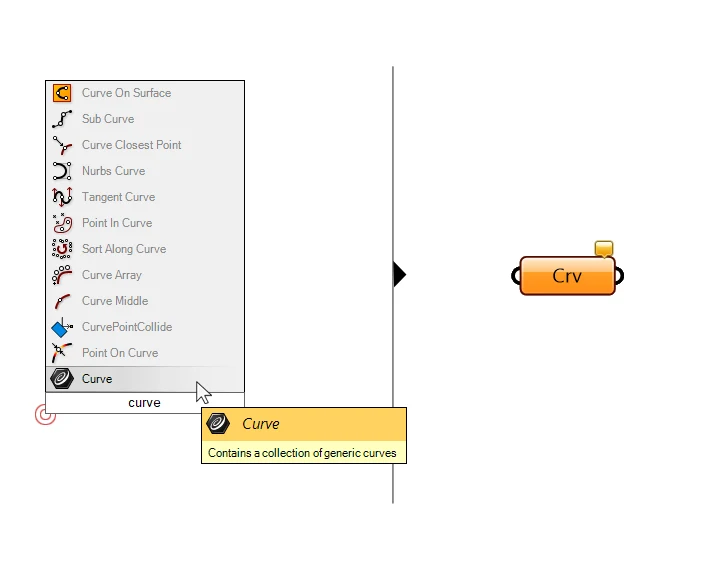
Next, let’s start up Grasshopper and reference these curves to a Curve container component. Add a curve container by double-clicking onto the Grasshopper canvas and typing “Curve”. Select the component with the black hexagon icon. If you hover over it, the tooltip should say: “Contains a collection of generic curves”.
To reference the curves to the Curve container, right-click on it, and select Set Multiple Curves. Then select all three curves in Rhino and confirm your selection with a right-click.
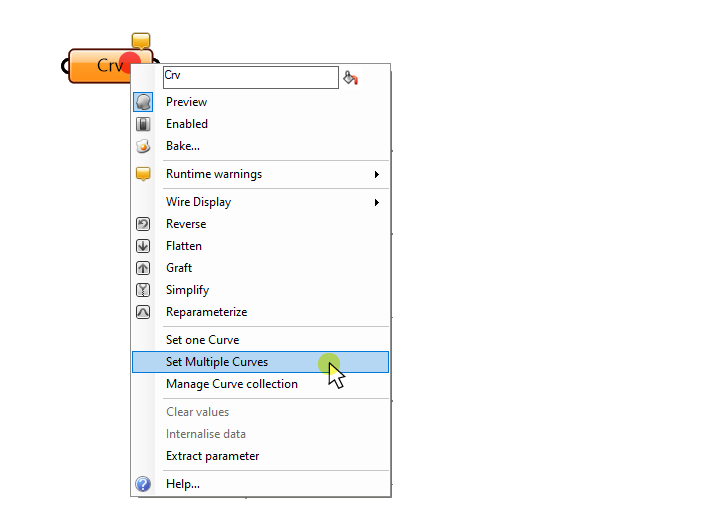
The Curve component should now turn gray.
When we select the Curve component, the referenced curves are highlighted in the Rhino viewport, confirming that they are successfully linked. But there is a more precise way to check the output of a component: The Panel.
The Panel: Your Diagnostic Tool
The Panel allows us to see the contents and data structure of a component’s output, in text form. So while we can see the preview of our selected Curve component in the viewport, the Panel allows us to double-check the exact number of items, and their type.
The Panel is an important part of our diagnostic toolset when building our scripts in Grasshopper. We can use it to ensure that the components output what we expect them to. We’ll be using the Panel throughout our scripts to check data before connecting it to other components.
Now let’s add a Panel, to see the output of our Curve component. We can select it from the standard component tab, it’s the yellow icon, or we type “Panel” into the component search bar.
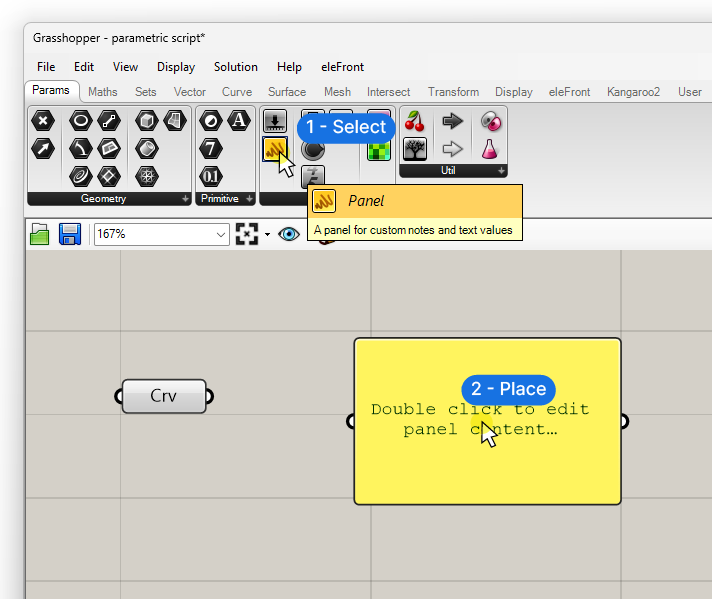
The Panel is like a simple text field and it has only one input and one output. To display the contents of a component, simply connect it to the Panel’s input. Let’s connect our curves.
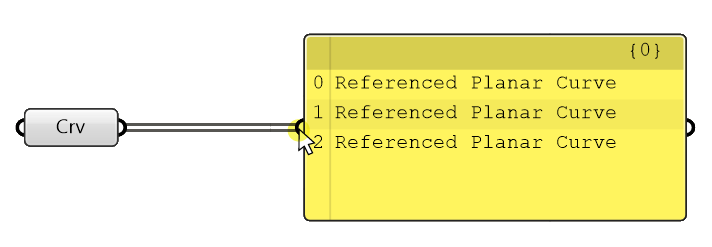
As soon as we connect a component, the Panel turns into a table and displays all the items the component contains in a list. A brief description of each element reveals the datatype. In our case, the text reads “Referenced Planar Curve”.
Great! We’ve confirmed that our Curve component does in fact contain three curves, so let’s move on to the next step: dividing the curves.
Dividing Curves in Grasshopper
Let’s start by adding a Divide Curve component. We double-click onto the canvas where we want to component to be placed, type “Divide Curve”, and select the first result.
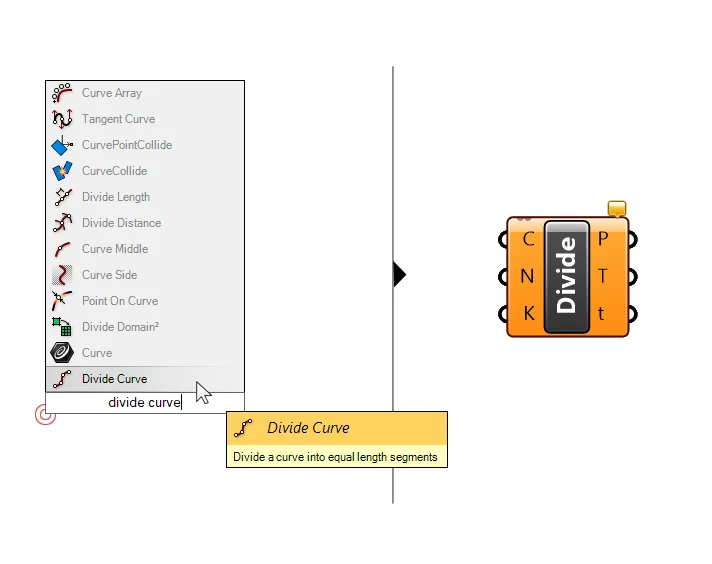
The Divide Curve component creates a specified number of equally spaced points on the curve and outputs additional information about the curve at those points.
Let’s learn about the required inputs by hovering over them: The first one, ‘C’, is the Curve to divide. Let’s connect our Curve container output.
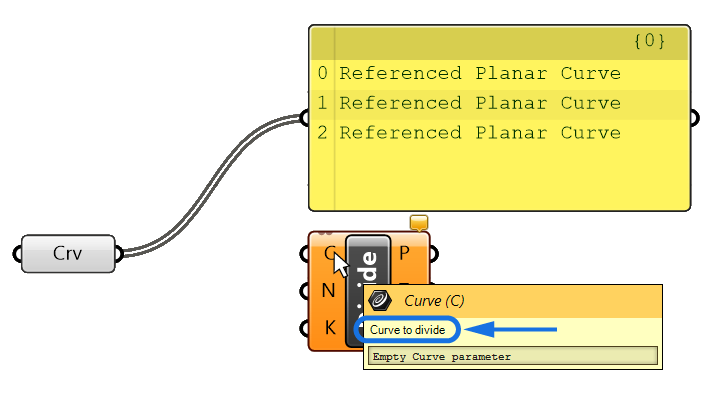
Make sure to create the connection between the actual curve container, and not the panel. The output of the panel is not the curves themselves, but exactly what’s shown in the panel: a list of text items.
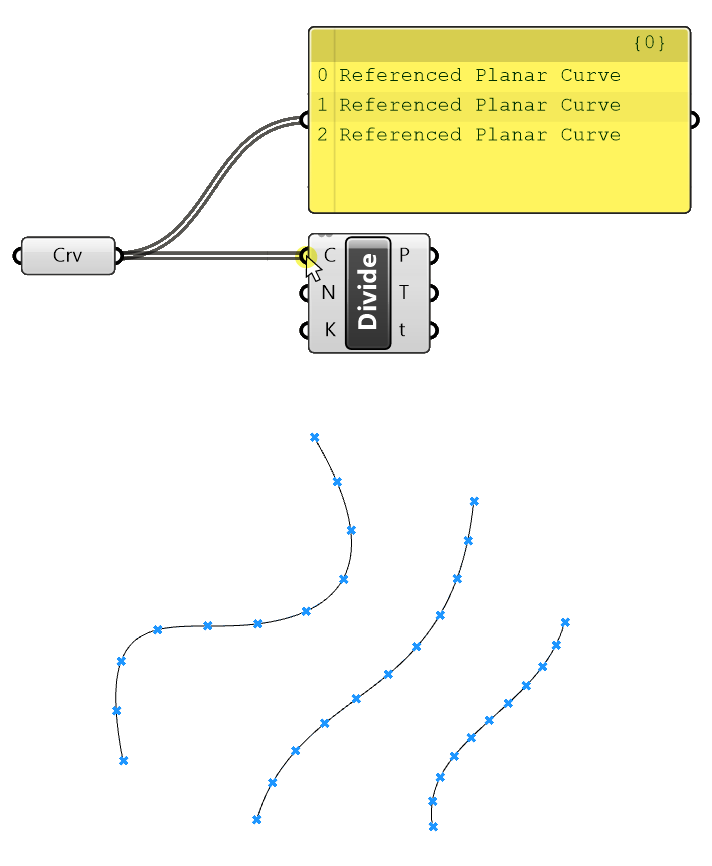
We see that division points already show up on our curve, that’s because the default value of the next input N, which is the number of segments, is 10. In a moment, we’ll add a number slider to dynamically adjust this number. But first, let’s check out the outputs by hovering over them:
The first output is the division points (P). These are simply points, equally spaced along the curve. In addition, the Divide Curve component also outputs the tangent vectors (T) at the division points, and lastly the curve parameters (t) that describe the location of the division points on the curve. We could use that information to for example, split a Curve at those points.
For now we are only interested in the points themselves.
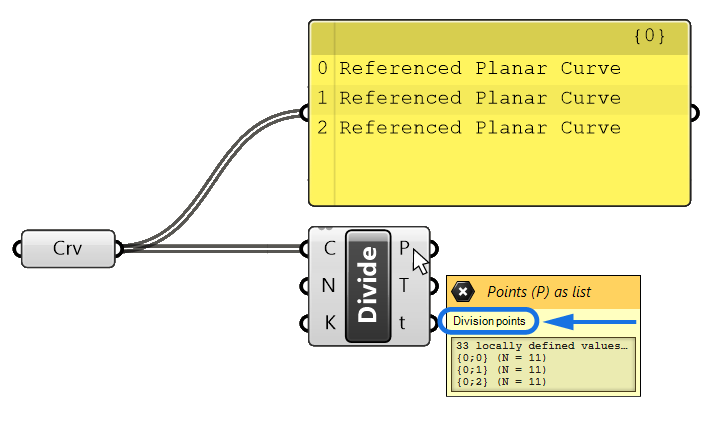
Let’s move over our Panel and connect the Points (P) output to see what it looks like.
Evaluating the result with the Panel
Since we generated a lot of points, the list inside the Panel exceeds the Panel boundary. We can resize the Panel to see more of the contents or scroll through with the scroll bar on the right hand side.
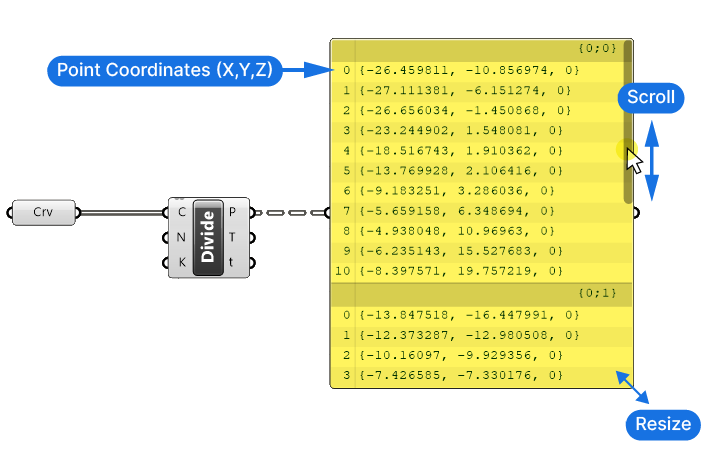
Because a Point is simply defined by its three X,Y and Z coordinates, which are just numbers, the Panel actually shows us all three coordinates of the Point instead of just writing “Point”, as it did with the curves.
We divided each of the three curves into 10 segments, generating 11 points per curve (we get one more point than we get segments, because the component outputs both the start and endpoints).
The Panel shows the points in three sets of 11 points, each in their own list. This “grouping” into separate lists is Grasshopper’s way of keeping track which points belong to which curve. In more advanced scripts, this so-called data structure will become important for controlling which objects are processed together.
Let’s add a number slider to interactively adjust the number of divisions to make our script more dynamic!
Number Slider: Adjusting Design Parameters
Building a parametric model in Grasshopper is only useful if we are able to interact with its parameters. In Grasshopper, the Number Slider is one of the primary tools to do so. Let’s type “Number slider” into the component search bar, and select the component to add it.
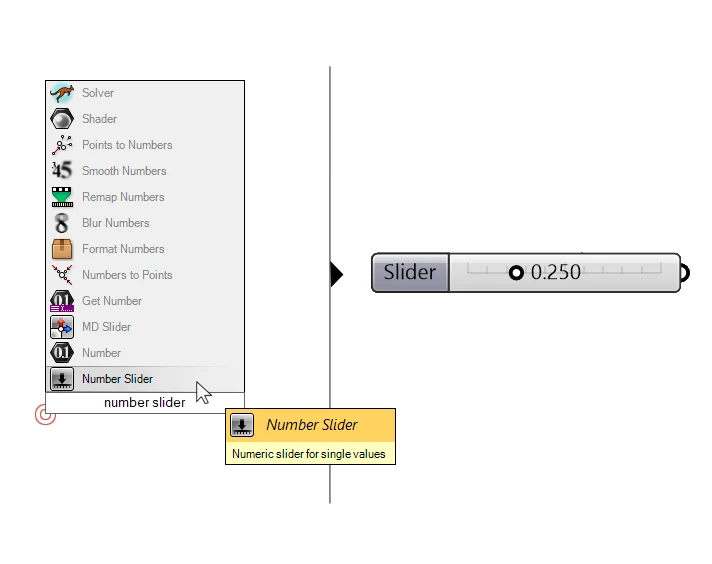
As the name suggests, we can “slide” the dot to change the output value of the component.
When we drop the number slider onto the canvas this way, the slider will come with a preset value of 0.250 and a preset range between 0 and 1.
We can change the range and precision of the number slider by double-clicking onto the left, dark gray part of the component.
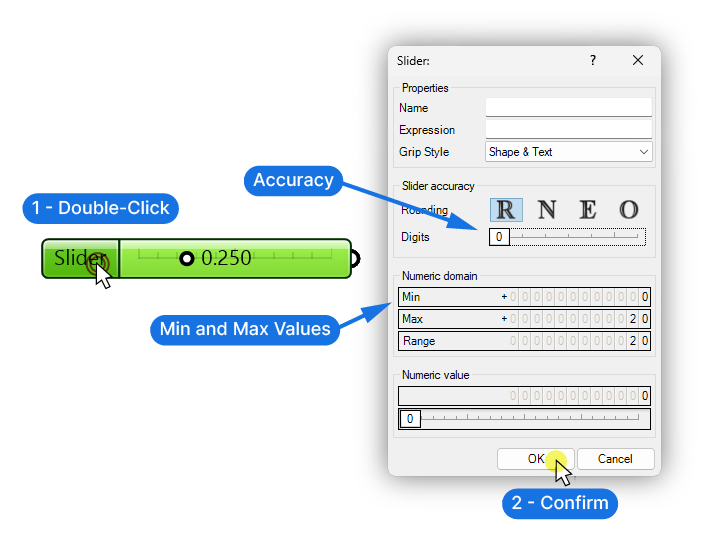
In the menu that pops up, we can define the domain or minimum and maximum value of our slider. We can change the values by double-clicking into the fields and typing a number. Let’s change the minimum to 0, and the maximum to 20.
Above, we can adjust the slider accuracy by specifying the number of digits after the comma. Since we need whole numbers to define the number of segments, let’s set it to 0. Let’s hit OK to confirm.
The slider range and precision is now updated. To change the values, we simply move the slider by clicking and dragging. We can also manually set a specific number by double-clicking into the slider area and typing the number.
Let’s set it to 5 and plug it into the “Number of Segments” (N) input of the Divide Curve component. We can slide through the numbers and check in the preview if it works as expected.
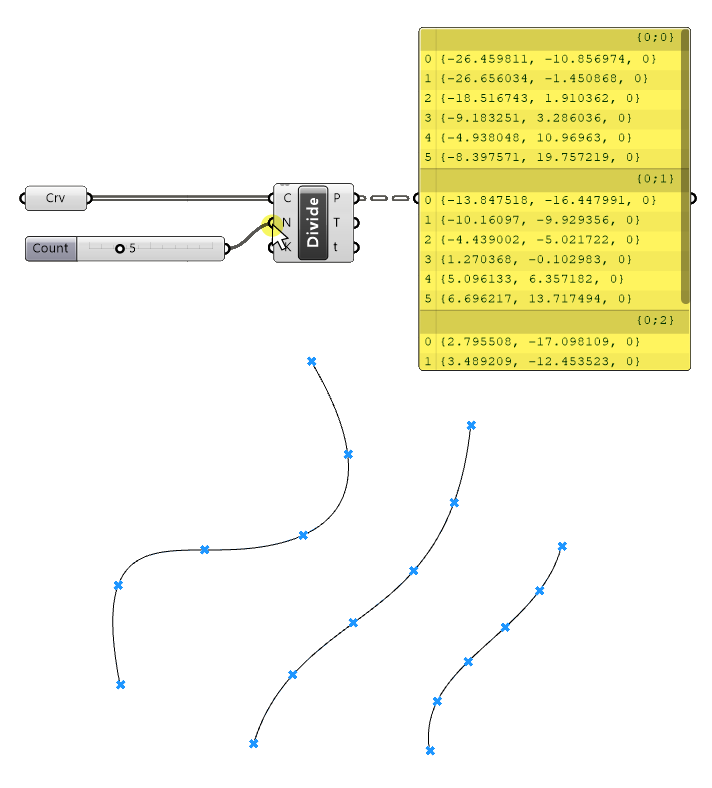
As we move the slider, the Panel also updates to show the resulting output.
Advanced Panel Functions: Writing and Data
Our goal is to subdivide the curves into segments of similar length. That means that we’ll need to specify a different number of subdivisions for each curve. Let’s learn how to do that.
Since we have three curves, we need to provide three different numbers to the “Number of Segments” input.
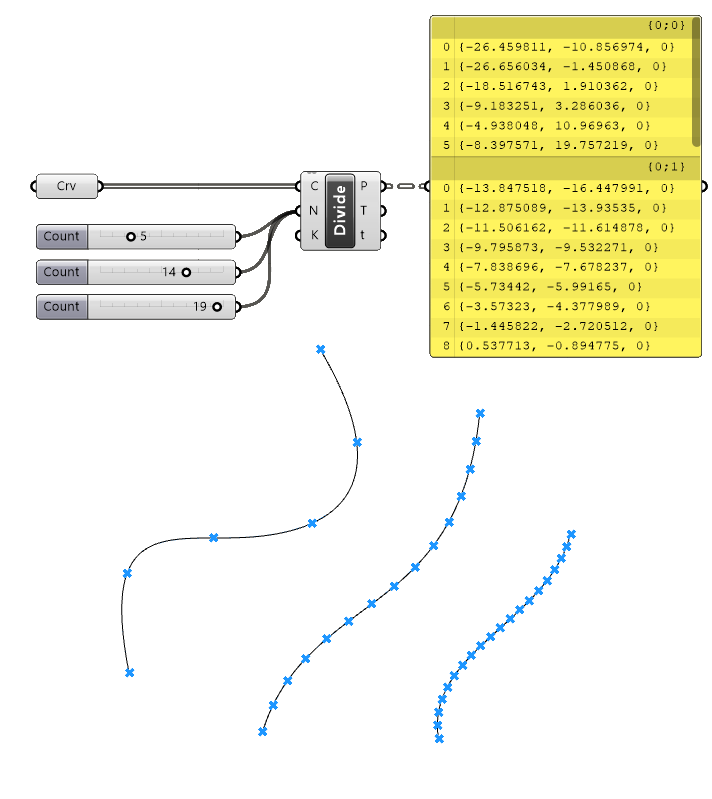
One way to do it is to add two more Number Sliders and connect them all to the “Number of Segments” input. (Press Shift as you create the connection to add instead of replace a connection).
But we can also type the numbers out in a Panel. Here’s how:
The Panel is not limited to just displaying the content of components – we can also use it to type in information. We can only do that if there is no input connected – if a component is connected, it will override our manual input.
Let’s drop a new Panel component onto the canvas.
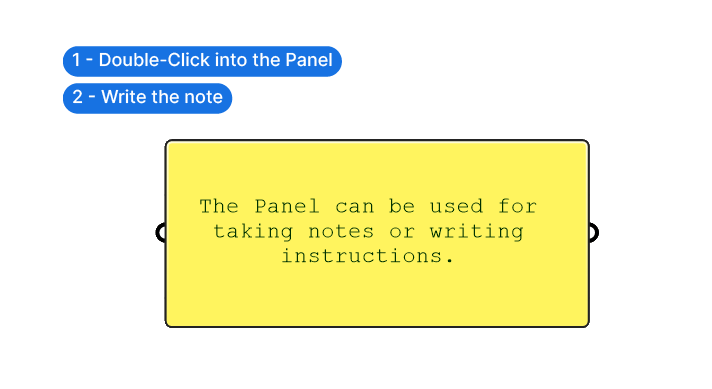
We can add text just like in a simple text editor by double-clicking on it. It can be used as standalone component to add notes or instructions in a script.
But we can also use it as a way to enter numbers that will drive our script. To do that requires an extra step.
Using the Panel as input method
Let’s start by typing three numbers followed by enter to get three numbers on three lines.
By default, anything we type into the Panel is considered a single text block, meaning one text object. Even if our numbers look like a list of three values, to Grasshopper they are still a single text block.
If we want each line to be considered as a separate value, we need to right-click onto the Panel and turn off Multi-line Data.
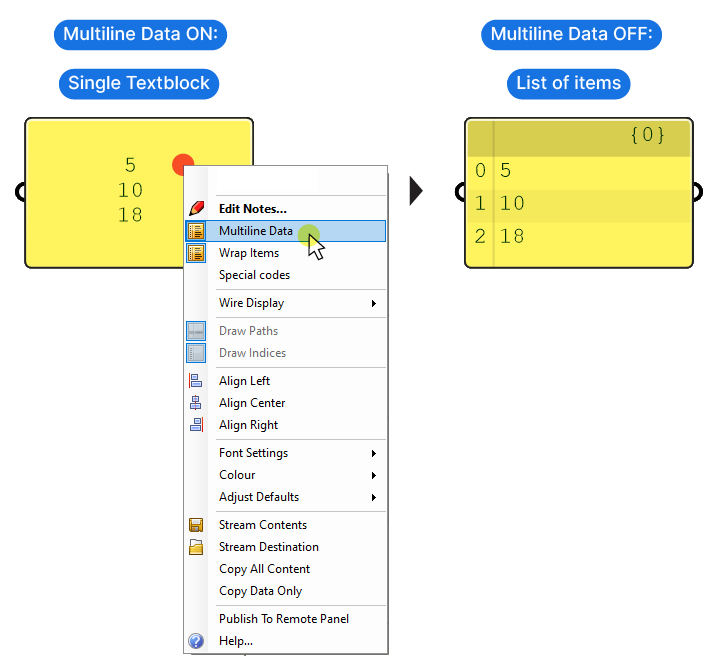
As you can see, the preview now shows the same content as a list of numbers.
If we connect these three numbers to the “Number of Segments” input of the Divide Curve component, we get a different number of division points for each curve, as we can also see in our Panel component.
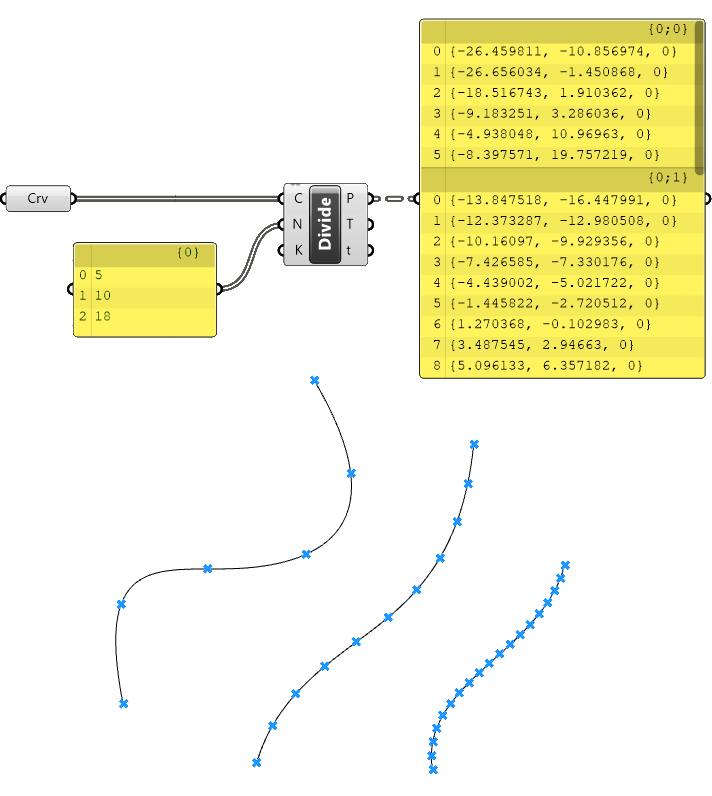
We successfully specified a different number of divisions for each curve, but we still have to change the the numbers manually. Let’s find a way to specify the number of divisions parametrically, next!
Parametric Division: Adapting to Curve Lengths
To create parametric relationships in our Grasshopper model, we need to take one property of an object and use it to define another. In our example, we want to create a parametric relationship between the length of the curves and the number of subdivisions. That way, we’ll end up with a similar spacing between the points across all curves.
To turn this parametric relationship into components we need to further break it down into logical steps. In our case, we can specify a target length for the segments and divide the length of the curves by it. We’ll get a number that we can round to a whole number to get the segments per curve.
Let’s implement this logic.
Extracting the length of the curves
First we need to get the length of our curves. We can use a component called “Length” for it. Double-click on the canvas to open the component search bar and type “Length”. There are many components with the word “length” in it. Make sure to pick the component that says “Measure the length of a curve” when you hover over it.
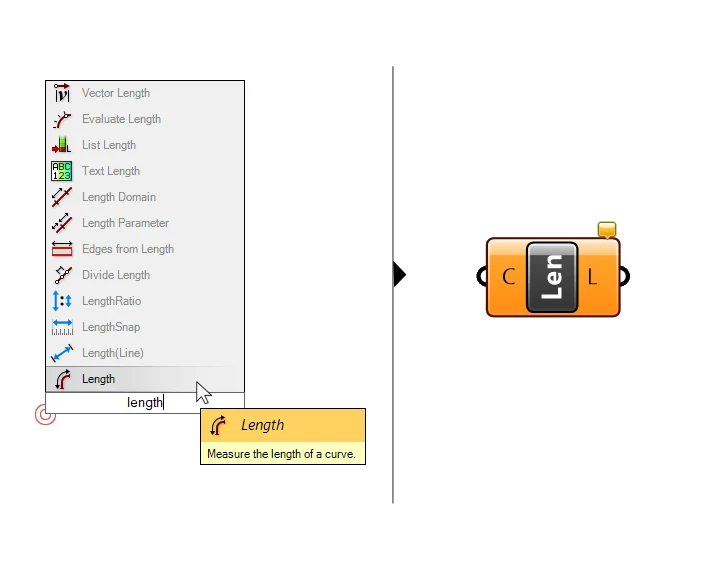
The Length component takes a curve as an input and, you guessed it, outputs the curve’s length. Let’s connect our Curve container.
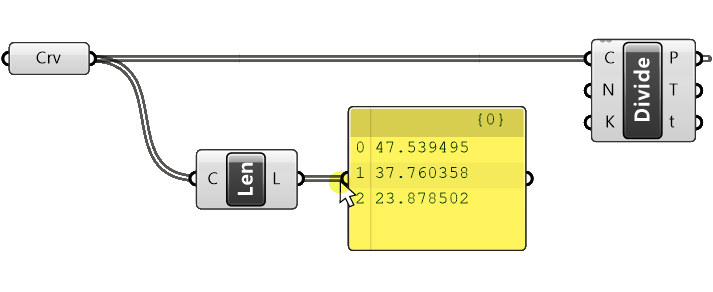
The output of the Length component is a number. We can check and see the output by connecting it to a Panel component.
Next let’s define our target spacing.
Advanced variable definition with the number slider
Let’s add a new Number Slider that will define the target spacing of our Points on the curves. Let’s use a more advanced method of inserting a Number Slider this time:
If we type a number directly into the component search bar and hit Enter, Grasshopper will create a slider for us, with that number as the value.
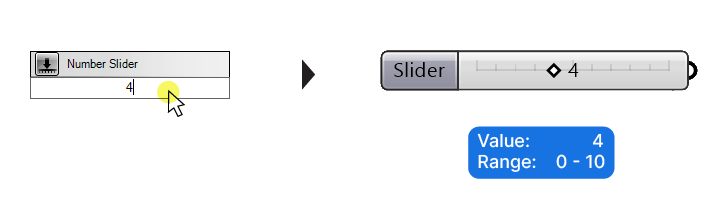
Depending on the number we type, Grasshopper will generate a range, or minimum and maximum value. This range depends on the value we enter. By typing 4 for example: you’ll get a slider between 0 and 10.
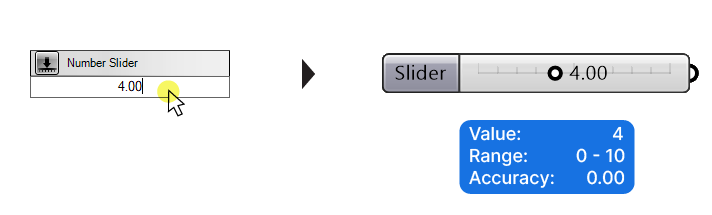
We can also define the precision of the Number Slider this way.
If we type “4.00”, the slider will be between 0 and 10 and have a precision of 2 digits after the comma.
Let’s use this number slider to define our target spacing.
So, we have the curve length and the target spacing, next we’ll define a parametric relationship between the two values!
The Expression Editor: Mathematical Operations Simplified
It’s time for some math! To create a parametric relationship between the curve length and the spacing, we’ll use a simple division. We’ll divide the curve length by the target spacing to get the number of segments.
Throughout our scripts, we’ll use mathematical expressions to control different object properties. In 99% of cases, it will be very basic operations: additions, divisions, multiplications, subtractions or a combination of them. No need for advanced algebra!
To enter any mathematical formula in Grasshopper, we can use the “Expression” component. Let’s double-click on the canvas and type “Expression” and add the component.
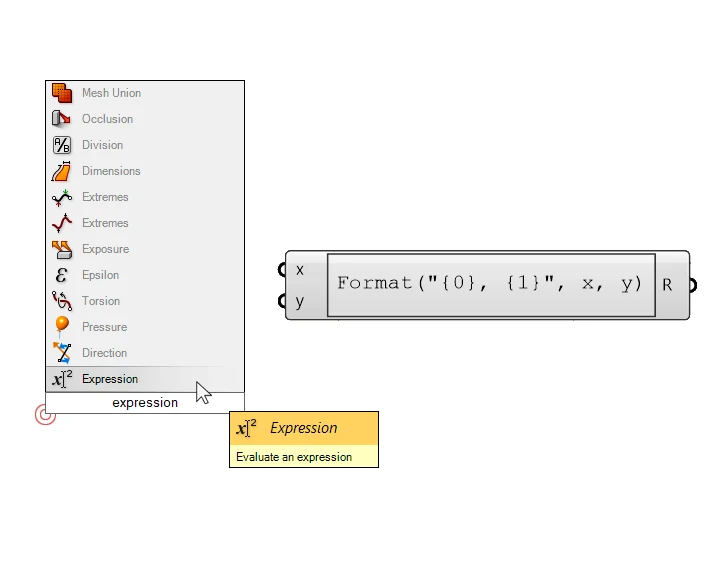
Don’t mind the notation that shows up in the middle of the component: it is a template that we’ll replace with our own formula in a second!
First let’s look at the anatomy of the component: we have simple x and y inputs, which will be numbers, and one resulting number output (R).
If we zoom in close to the inputs of the expression component, small plus and minus signs appear (you’ll get a tooltip with a countdown the first time you do it).
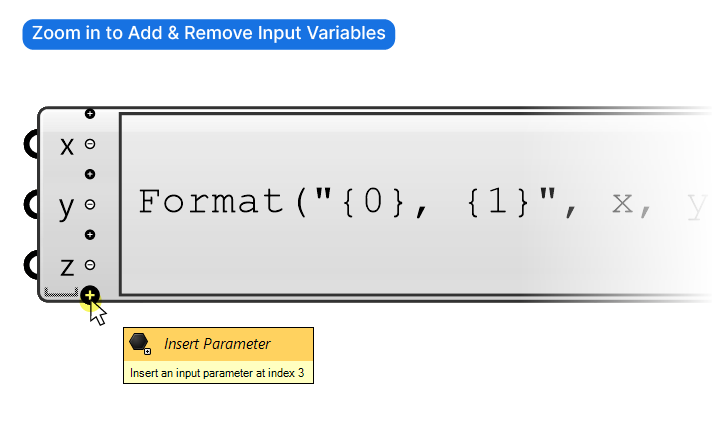
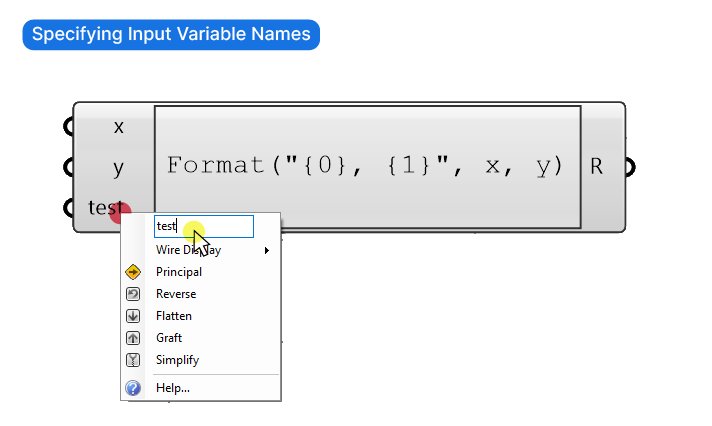
By clicking the plus and minus symbols, we can add or remove inputs from our formula. These inputs will be the variables we can use in our formula. We can give the inputs any name we want by right-clicking on them, as long as we use the same name in our formula as well.
Although there are different mathematical components, we could for example use the “Division” component, I recommend to always use the expression editor for mathematical operations. Instead of using ten different components, we can use one that can do everything. The main advantages are that we can easily type and modify any formula, that we see the formula directly, and that we can do multiple operations in one component.
Entering a formula in the expression editor
Now let’s add our formula!
To open the expression editor, double-click on the central formula area. In the editor that pops up, we can define any mathematical formula we need. Let’s delete the existing template and simply type
x / y“x” will be the curve length, and “y” the target spacing.
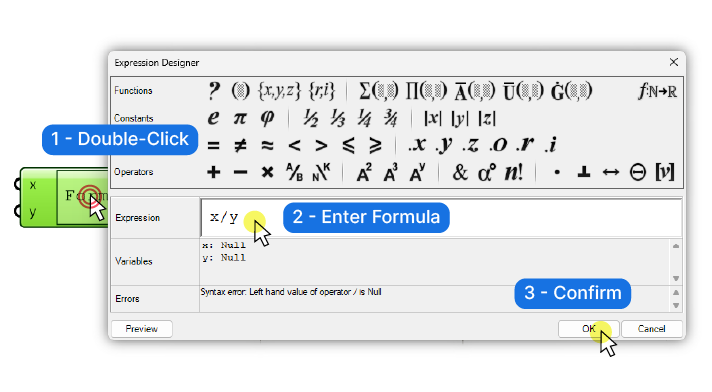
All the buttons above the expression input field can help us with typing in the formula, but for most cases, we can just type in the formula using our keyboard. Up in the top right corner we can access a list of additional commands with a short description. You can find the notation for Sine and Cosine etc. here, if you are feeling adventurous!
Once we are happy with our formula we confirm with OK.
When we confirm, the component turns red because we haven’t provided any inputs yet.
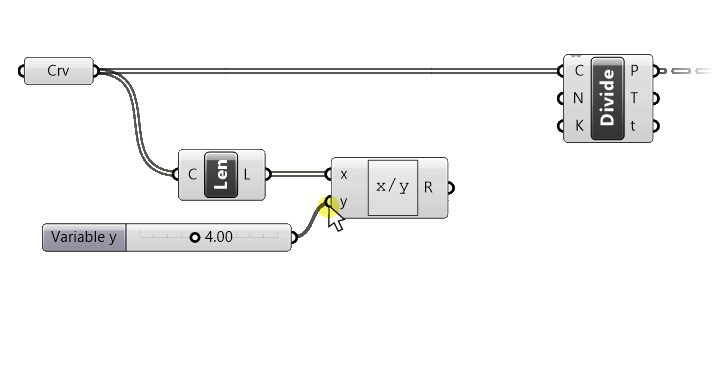
Let’s connect our curve lengths to the x input, and the Number slider to the y input.
We can once again check the output by plugging it into our Panel component.
Our output is not a whole number because our curve lengths and spacing aren’t either.
Let’s plug this result into the segment number (N) input of the Divide Curve component.
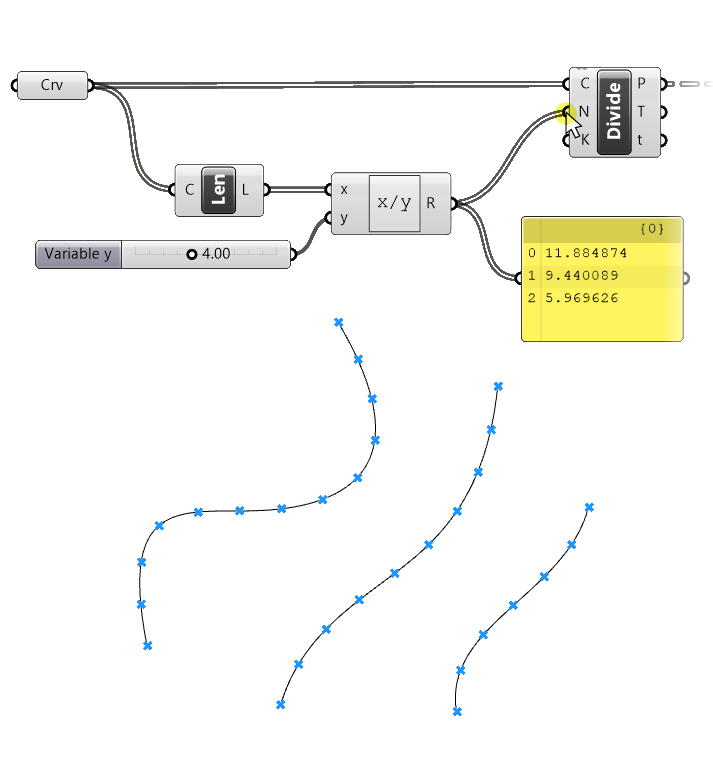
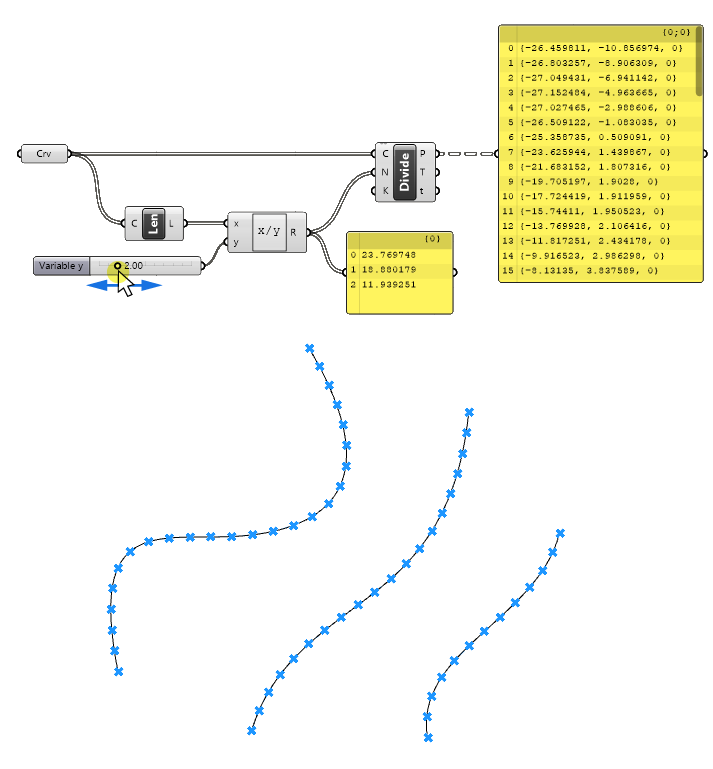
The curves are now parametrically divided into segments of similar length!
Grasshoppers automatic datatype conversion
We can see by hovering over the segments (N) input that Grasshopper turned the numbers into whole numbers for us.
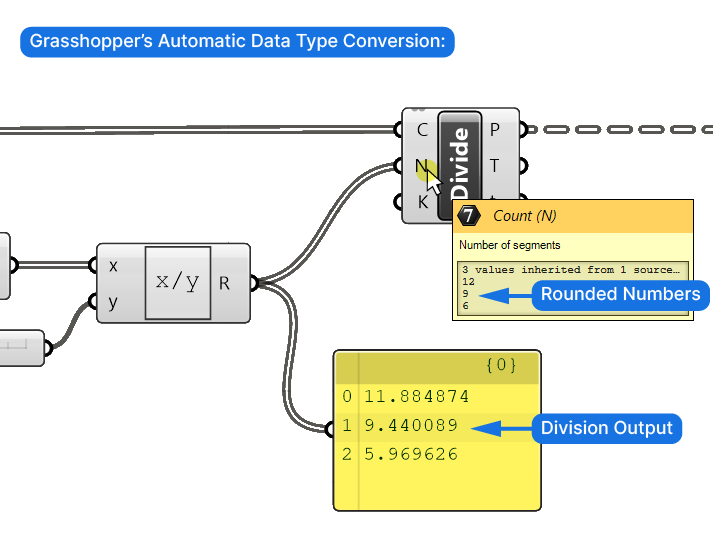
Grasshopper will often automatically convert one data type into another one, if possible, to make work easier for us. In this case a floating point number like 11.884874 will be turned into a whole number (integer) by rounding to the nearest number: 12.
That’s it! We’ve created a simple parametric model in Grasshopper!
If we now change the value on our slider, we can see that each curve has a different number of points, and that the spacing between the points is similar for all curves. We can also see the update in our Panel component, showing us the different point lists.
Conclusion: Embracing Dynamic Design
We’ve taken our first steps into the world of parametric design in Grasshopper. From understanding the diagnostic insights of the Panel, harnessing the dynamic control of the Number Slider, and building parametric relationships with the Expression editor, we’ve built a script that showcases the essence of creating a parametric model inside Grasshopper. I hope this hands-on approach has given you a tangible sense of what Grasshopper can bring to the table when it comes to dynamic designs.
While we’ve covered significant ground, remember that this is just the beginning. To truly harness the power of Grasshopper for architectural design, a deeper dive is essential. This is where Grasshopper Pro comes in. Our comprehensive course is meticulously designed for architects who want to elevate their skills, offering a blend of advanced techniques and real-world applications. Dive into Grasshopper Pro and transform your architectural visions into dynamic, adaptable masterpieces!
Happy designing!