The Graphmapper component in Grasshopper allows us to redistribute a series of numbers using curve equations. By using interactive handles within the Graphmapper interface, we can adjust and control these curve equations.
The Graphmapper is the unsung hero of many world-class architectural designs of recent years. The ability to create and interactively control gradients makes it an indispensable tool in your arsenal as a designer. Any design that includes gradual and smooth geometric transition is built around this powerful component.
In this post I’ll go in-depth on how the Graphmapper works, how to set it up correctly, best practices, and how to use it to create 2D as well as 3D gradients.
Let’s dive in!
What does the Graphmapper do?
Here’s how the Graphmapper works in a nutshell:
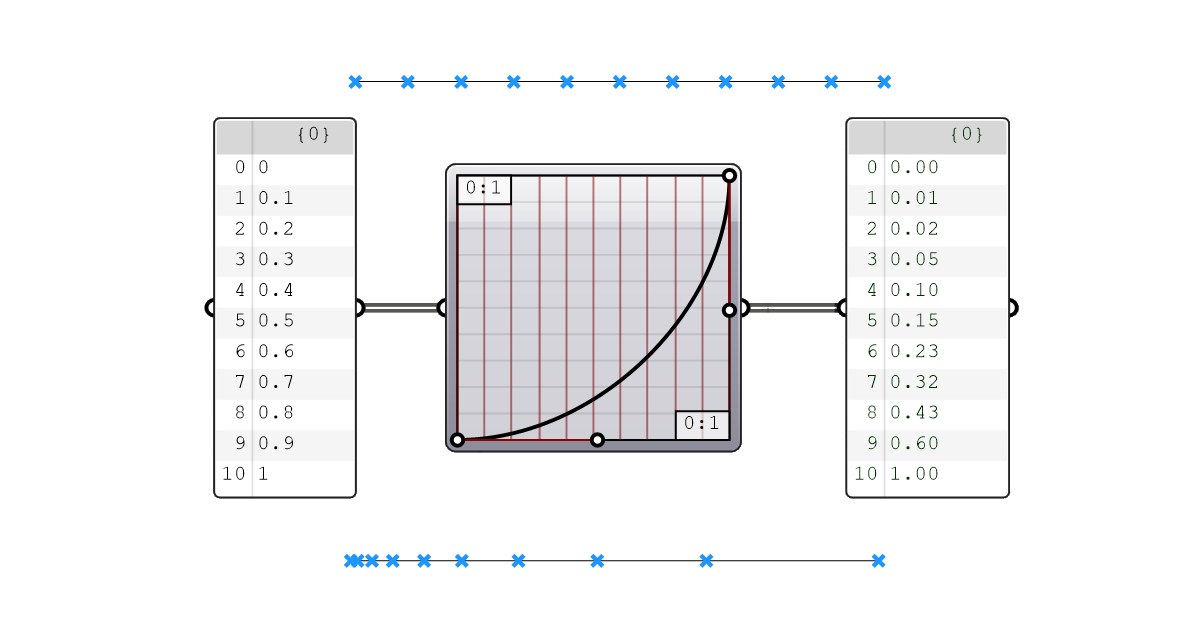
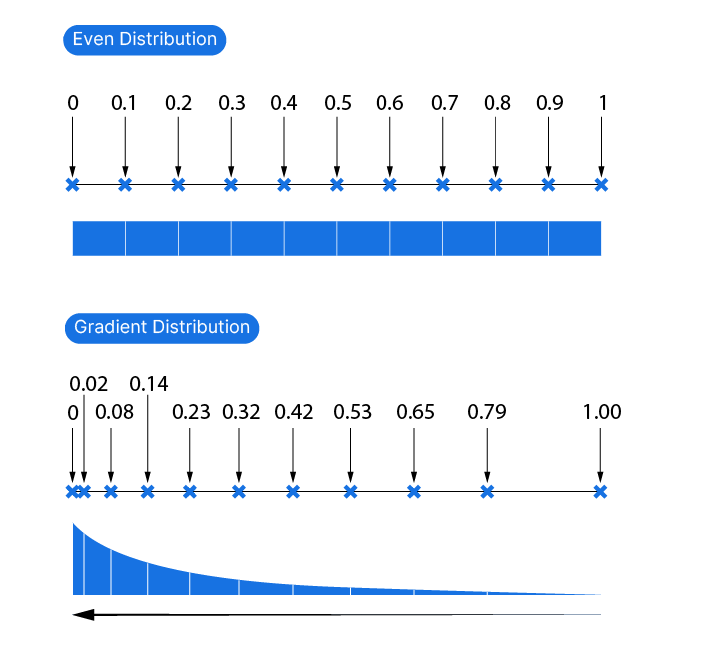
Imagine you have a range of 10 numbers, ranging from 0 to 10. The distance from one number to the next is constant, the numbers are equally spaced.
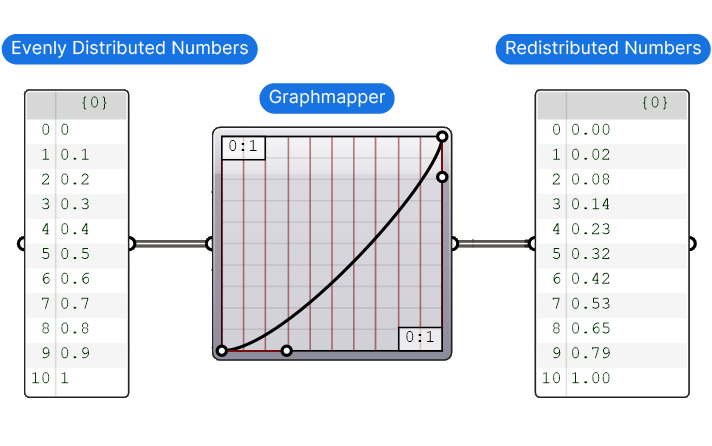
The Graphmapper allows us to take those values and redistribute them using a formula, creating a gradient spacing between the numbers. This means we can transform an even distribution into a gradient distribution.
To perform this redistribution, the Graphmapper uses mathematical functions that convert the original values into the redistributed ones.
Now since the whole point of visual programming in Grasshopper is that we don’t have to deal with the actual hard math behind our designs, the Graphmapper represents the formula graphically in the form of a curve in its own special interface.
And here is the best part: we can interactively edit this graphical representation of the formula by moving “curve handles” marked by white dots, and the numbers will adjust accordingly.
In doing so we can access the powerful world of mathematics while taking advantage of the intuitive and flexible visual programming approach.
How Values are Remapped Using a Curve Equation
Let’s dive a step deeper into how the Graphmapper works.
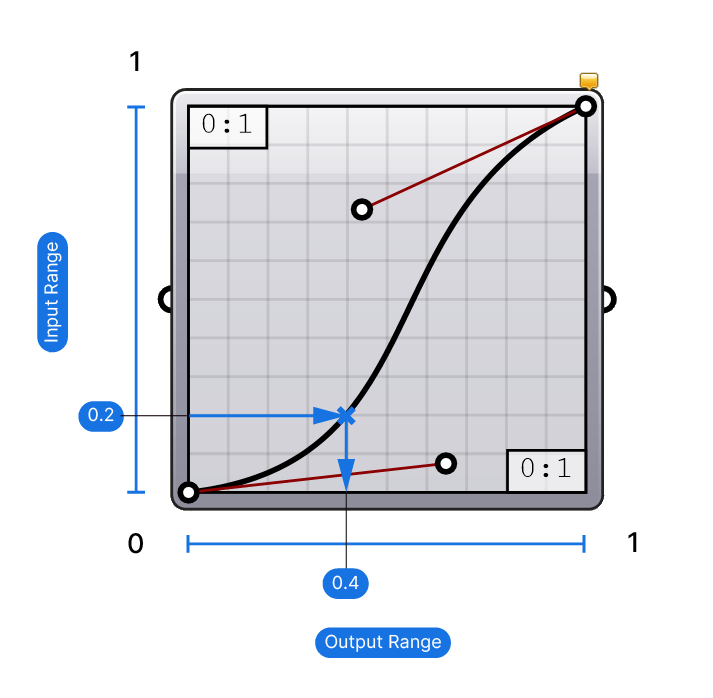
The redistribution of the values can be visually represented as a graph along two axes: the x- and y-axis. The input values are on the x-axis, and the output values on the y-axis. The curve inside the Graphmapper interface becomes the instrument that controls how the values are redistributed.
Consider an input value of 0.2 on the x-axis. We draw a line horizontally from 0.2 until it meets the curve. Then, we draw a vertical line to the y-axis, where it meets the value 0.4.
Similarly all the input numbers are remapped along the curve.
Let’s look at how to setup the Graphmapper with an example Grasshopper script next.
How to Add the Graphmapper to Your Script
To start, add the Graphmapper to your script. It’s located in the ‘Params‘ component tab, inside the ‘Input‘ group.
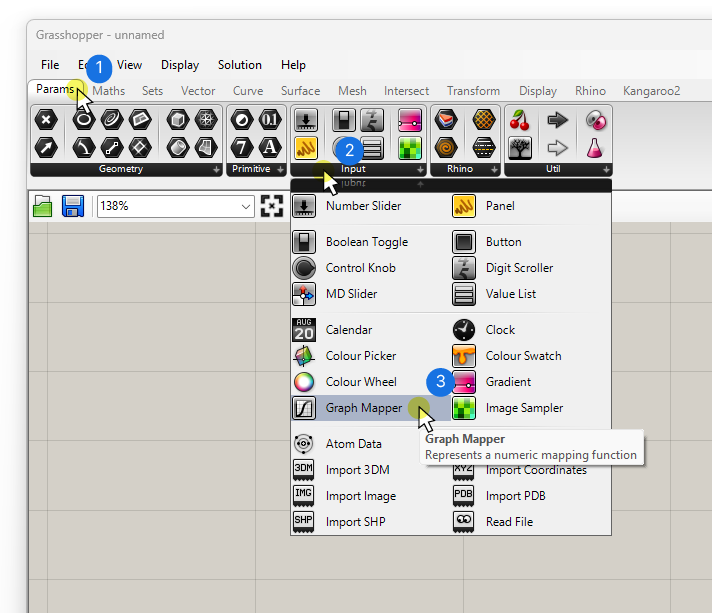
To add it quickly use the component search bar: double-click on the canvas where you want to add the component, type “graphmapper” into the text prompt and select the component.
When added, the component will display as an empty gray box. Let’s learn how to set it up.
How to Specify a Curve Equation
The first thing we need to do, is to specify what kind of curve equation we want to use. To pick one, right-click on the component, go to ‘Graph Types’, and select one of the ready-made formulas.
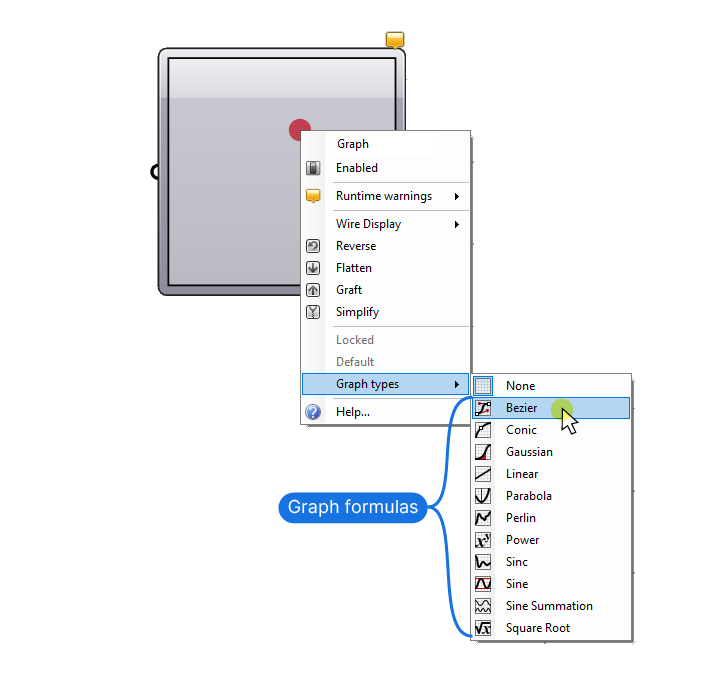
You can choose from common curve equation formulas, with small icons displaying a preview of the mapping they perform.
Here are the three graph formulas I’ve personally found most useful for design purposes:
- Bezier
- Gaussian
- Sine
And even among these, I’d say that in 99% of the time, the Bezier graph is the one you need. It gives you the most control. We’ll use it in this example.
Once you select a curve equation, the interface refreshes and shows the chosen graph, with white dots acting as handles you can move to edit the shape of the curve. These handles will differ from formula to formula.
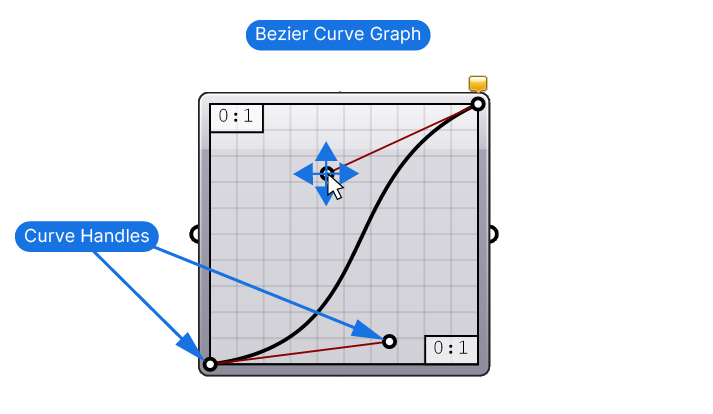
In the case of the Bezier curve, we get to choose the starting and ending point as well as their angles with two dots each.
Now that we’ve set up the curve equation, it’s time run some numbers through it!
Graphmapper Example Script Setup
For simplicity’s sake, we’ll use the Graphmapper to control the distribution of points along an input curve. Here’s the basic setup:
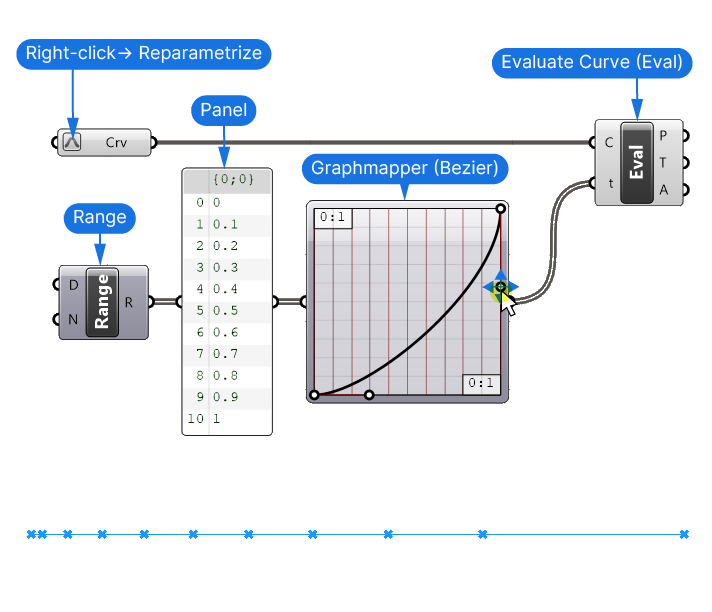
I referenced a curve and reparameterized it so its curve domain ranges from 0 to 1, and created a series of numbers between 0 to 1 with the Range component (using the default settings). I added a Panel to display these numbers.
Use the Evaluate Curve component to turn Graphmapper output values into points on the curve. Since we reparametrized the curve, the start of the curve will equal a curve parameter of 0, and the end will equal 1, matching the numerical domain of our numbers.
Connect the values to the Graphmapper, and its output to the Curve Parameter (t) input of the Evaluate Curve component.
By using the handles we can now interactively control the distribution of the points along the curve in the viewport.
How to Handle Input Values Outside the 0 to 1 Range
The values we want to redistribute with the Graphmapper rarely match the default 0 to 1 input domain. Most likely they will be arbitrary numbers, which may not even start from 0, like for example:
3.52 to 44.29If we use the numbers from the above domain on the default Graphmapper, all values will be reflected with the number 1, since that’s the closest domain number to our values.
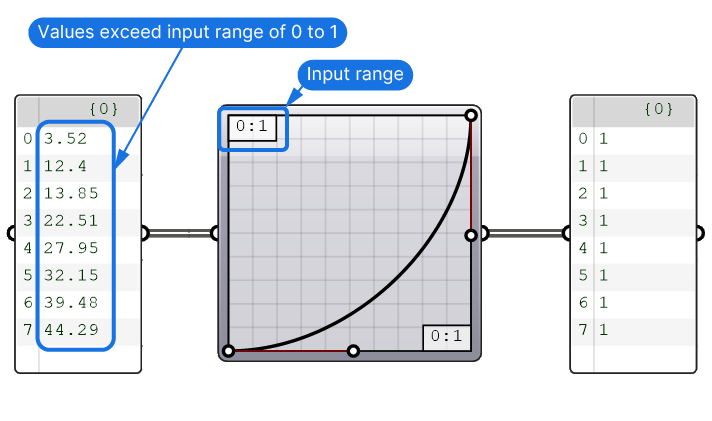
Unless the values are properly matched with the Graphmapper’s input domain, we won’t get the results we want.
There are two ways to deal with it:
Option 1: Manually Adjusting the Graphmapper input range
Once we’ve selected a curve equation, the default input and output ranges of 0 to 1 are displayed in the top right and bottom right corners. By double-clicking on the Graphmapper component, we can access the Graph Editor, allowing us to manually specify the domain (start and end) of both the input and output numbers.
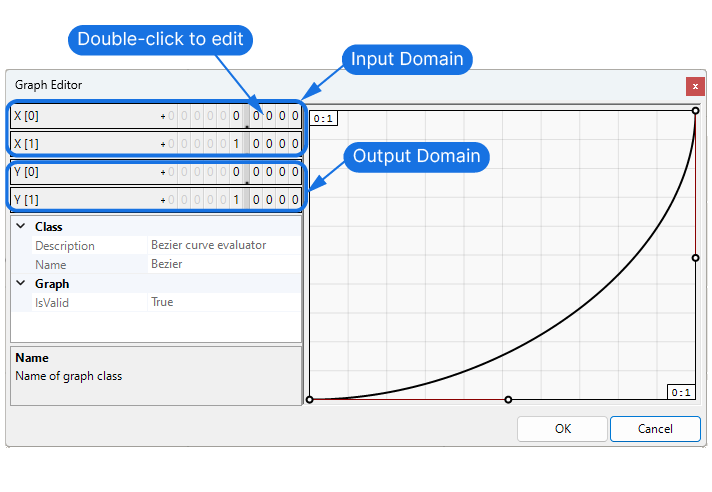
To properly redistribute all the numbers in the example above, we could set the input X[0] to 3.52, and X[1] to 44.29.
We can also adjust the output domain from the default 0 to 1 to anything we need.
The limitation of this approach is that we can’t set these parameters within the Graphmapper parametrically. Any time the numbers changed, we have to manually enter them. Which is why I recommend the second option.
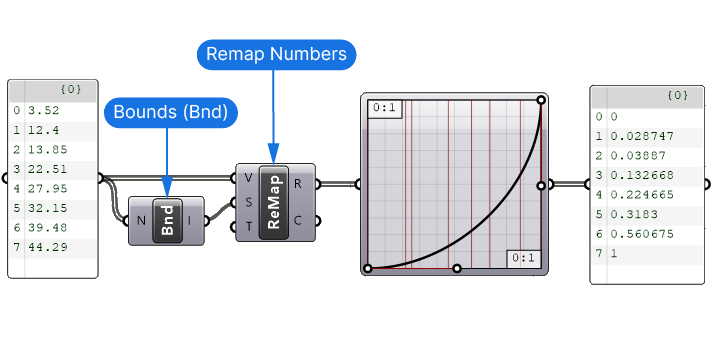
Option 2 (recommended): Remapping the Numbers to 0 to 1 before connecting them to the Graphmapper.
To ensure that the Graphmapper works as intended despite changes in the range of the input numbers, we can remap the numbers to the default domain of 0 to 1 before connecting them to the Graphmapper.
We can do so using the Remap Numbers (ReMap) component. Plug the values into the Values (V) input, provide the Source Domain (S) by extracting it first with a ‘Bounds‘ component, and use the default Target Domain (T), which is 0 to 1. All the values will be proportionally scaled from the source domain to the target domain.
We can use the same technique for Remapping the Numbers to a target domain after the Graphmapper component. In that case we specify the target domain with a Construct Domain component.
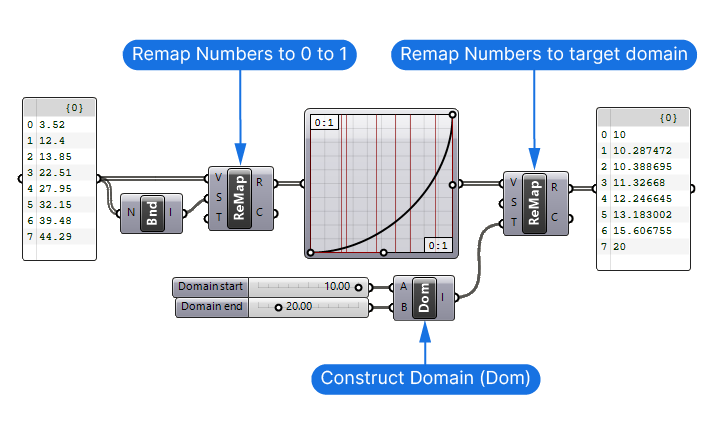
This method ensures that the Graphmapper works as intended for any set of values without our manual intervention.
Concluding Thoughts on the Graphmapper in Grasshopper
The Graphmapper component in Grasshopper is an incredibly versatile tool for designers, enabling the redistribution of numerical values through intuitive, visually represented curve equations. We’ve explored how to set up and use the Graphmapper, discussed its various curve equation options, and provided practical examples for implementing it in your design workflows.
I encourage you to experiment with the Graphmapper to discover its full potential!
Happy designing!